Ethereum managed to breach the $1,800 price mark initially, but it has since entered a phase of consolidation. Over the past 24 hours, there has been little progress in terms of price movement, reflecting a lack of significant advancements in Ethereum’s price within the weekly chart.
The technical analysis points to a bearish outlook for ETH, characterized by decreasing demand and accumulation. This indicates a waning enthusiasm among buyers as Ethereum trades sideways. The altcoin has been consolidating below a crucial resistance level, which, if successfully overcome, could potentially pave the way for a recovery.
For Ethereum to reverse its downward price trend, it will require broader market support, as evidenced by the formation of a pattern suggesting a potential bullish breakout in the near future.
Additionally, it’s worth noting that the market capitalization of Ethereum has declined, signaling a growing dominance of sellers and mounting selling pressure.
Ethereum Price Analysis: One-Day Chart
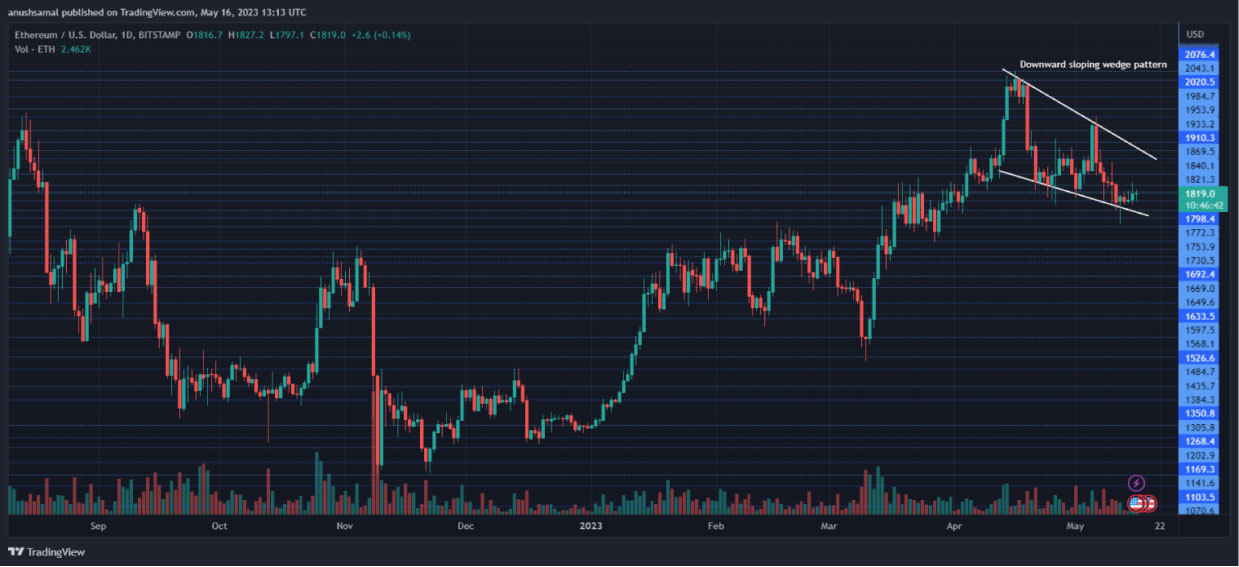
Following its breakthrough of the resistance level at $1,800, Ethereum has encountered challenges in establishing a clear price trajectory. The next notable hurdle for the cryptocurrency lies at $1,822, and if surpassed, it may open the door for an attempted breach of $1,840.
Presently, ETH is exhibiting a descending wedge pattern, which is generally viewed as a bullish formation and implies the potential for a future price reversal. However, should ETH retreat from its current position, it could potentially retest the $1,800 level and potentially even dip below $1,790.
Furthermore, the recent trading volume of Ethereum has experienced a decline, signaling a reduction in buying power. Nevertheless, this decrease in volume could also indicate a sense of exhaustion among sellers.
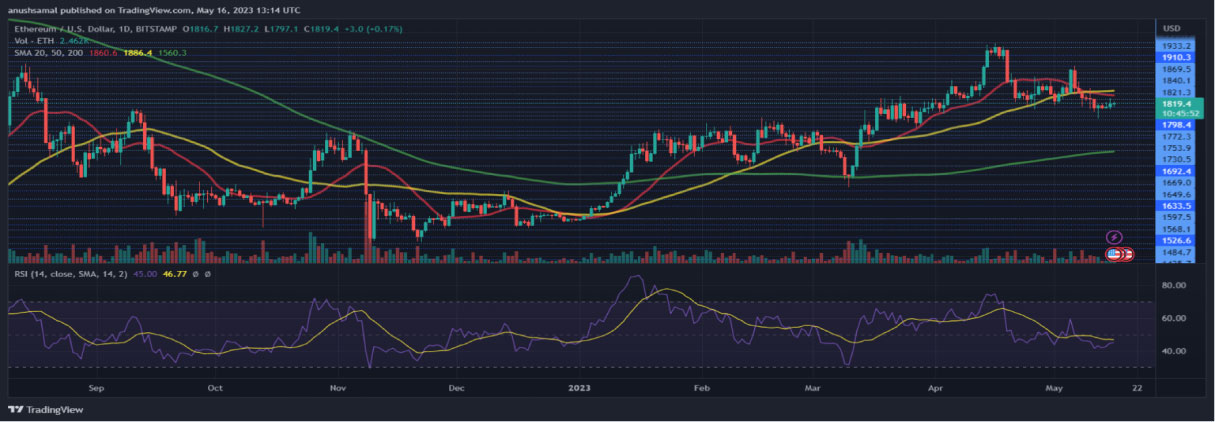
ETH buyers find themselves in an unfavorable territory due to the recent downtrend in price. The Relative Strength Index (RSI) reinforces this observation, indicating a prevalence of sellers as it remains below the midpoint line.
In addition, Ethereum has slipped beneath the 20-Simple Moving Average (SMA) line, highlighting a diminished demand and underscoring the influence of sellers in dictating the market’s price momentum.
Nevertheless, even a slight uptick in demand could potentially propel ETH beyond the subsequent resistance level, consequently bolstering the position of buyers within the market.
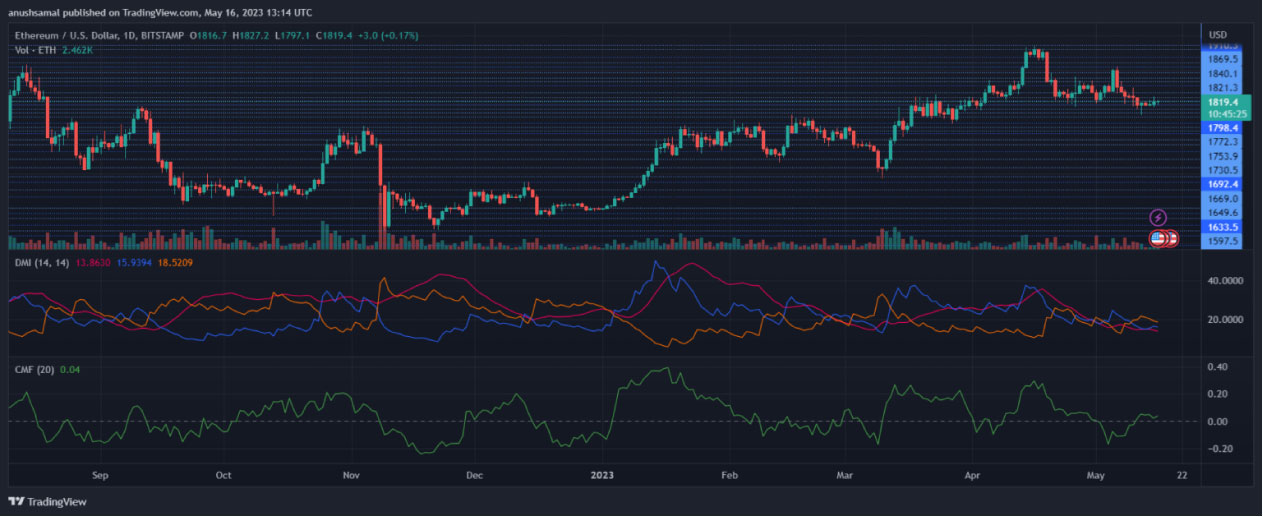
The price movement of ETH continues to exhibit a negative trajectory, aligning with the findings of various technical indicators. The Directional Movement Index illustrates a downward trend, as the -DI line (orange) remains positioned above the +DI line (blue).
Furthermore, the Average Directional Index (Red) remains below the 20-mark, indicating a lack of strong price direction. However, there is a glimmer of potential recovery hinted at by the Chaikin Money Flow indicator. It has risen above the midpoint line, suggesting that capital inflows are surpassing capital outflows.
Follow for more:
Telegram: https://bit.ly/3KbviBe
Twitter: https://bit.ly/3Zr6h9E
Website: https://bit.ly/3FWBaMc