The current trading price of the flagship cryptocurrency is $26,895, which means a significant decrease of 61.04% from the all-time high of $69,044.77 reached over a year ago, especially in November 2021. Merely days prior, Bitcoin struggled to surpass the $27,000 threshold.
Bitcoin market have coincided with dovish remarks made by Jerome Powell, the Chair of the U.S. Federal Reserve. Powell hinted at the likelihood of the central bank scaling back its series of interest rate hikes due to challenges encountered within the banking industry.
Typically, an atmosphere characterized by relaxed monetary policies and low interest rates has proven advantageous for risk assets, including the prominent crypto king. However, the prevailing trend presents a discernible deviation from this established pattern.
The correlation between Bitcoin’s well-being and the performance of risk assets underscores the interconnected nature of cryptocurrencies and conventional financial markets.
Bitcoin Price Remains Range-Bound as Bulls Defend Key Support
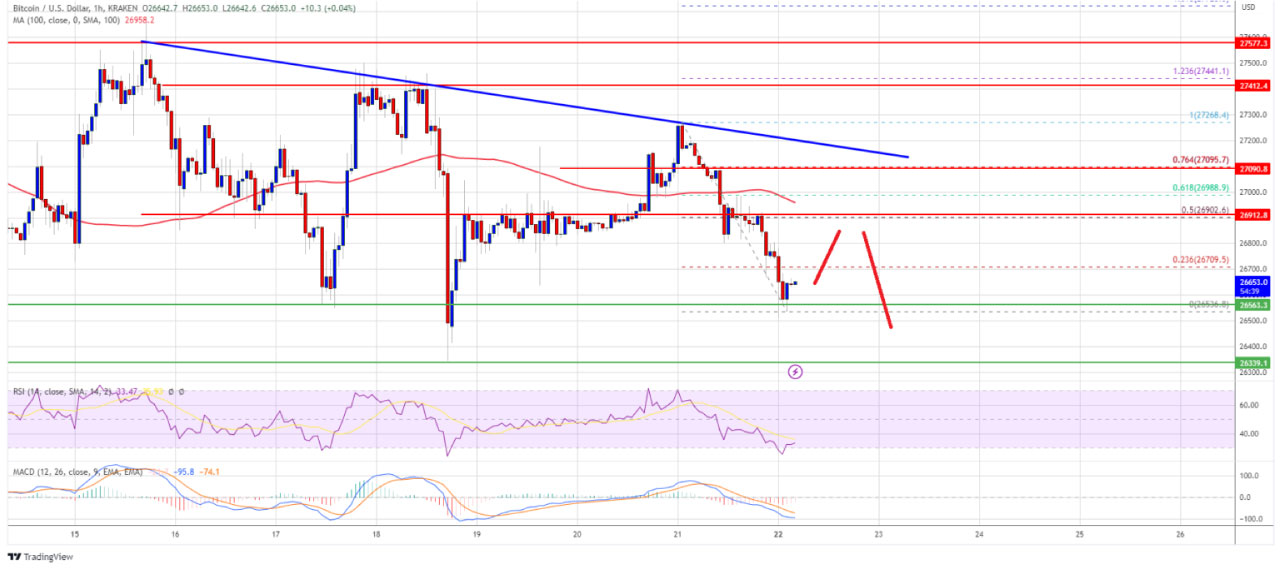
The price of Bitcoin recently witnessed a downward move, breaching the $27,000 level. Furthermore, it dipped below the crucial $26,800 support zone, erasing a significant portion of its earlier gains. However, the bulls quickly sprung into action near the $26,550 support level.
Following a brief dip, the price found support around $26,536 and is now in a consolidation phase, indicating a bearish sentiment below both $27,000 and the 100 hourly Simple Moving Average. Notably, an important bearish trend line is taking shape with resistance near $27,120 on the BTC/USD pair’s hourly chart.
As the price attempts to recover, it faces a hurdle near the $26,720 level, which aligns with the 23.6% Fibonacci retracement level of the recent decline from the $27,268 swing high to the $26,536 low.
Looking ahead, the next significant resistance level lies around $27,000, in close proximity to the 100 hourly Simple Moving Average. This level also coincides with the 61.8% Fibonacci retracement level of the recent decline from the $27,268 swing high to the $26,536 low. The trend line presents the initial substantial resistance level to watch for.
Are Further Declines Imminent for BTC?
Should Bitcoin’s valuation fail to surpass the resistance level at $27,120, a continuation of its downward trajectory may be anticipated. Immediate downside support can be found around the $26,550 threshold.
The subsequent significant support rests within the vicinity of the $26,350 range, potentially paving the way for a bearish trend. In such a scenario, a test of the $25,800 mark is conceivable. Subsequent losses could drive Bitcoin closer to the $25,500 level in the foreseeable future.
Technical indicators:
Hourly MACD – The MACD has now entered the bearish zone, displaying an accelerating trend. Hourly RSI (Relative Strength Index) – The RSI for BTC/USD has fallen below the 50 level. Key Support Levels – $26,550, followed by $26,350. Key Resistance Levels – $27,000, $27,120, and $27,500. Surmounting the $27,120 resistance could alleviate selling pressure. The next significant hurdle lies near $27,550, breaching which the price might embark on a noteworthy upturn towards the $28,000 resistance. Further gains could propel the price closer to the $28,500 threshold.
Follow for more:
Telegram: https://bit.ly/3KbviBe
Twitter: https://bit.ly/3Zr6h9E
Website: https://bit.ly/3FWBaMc


